
Anticipating customer demands into the future can be tricky. But a new tool could revolutionise the accuracy of business forecasting.
How does Walmart decide how much shampoo to stock in its stores in a year’s time? And whether a store’s customers prefer one brand of shampoo over another? Enter the murky predictive world of sales forecasting.
Knowing what the future holds is reasonably simple if a business just sells one kind of product in one region. But it becomes much more difficult to estimate once you add more layers. Taking account of different products, time periods and different stores, cities, regions and countries, the odds of getting it right blow out exponentially.
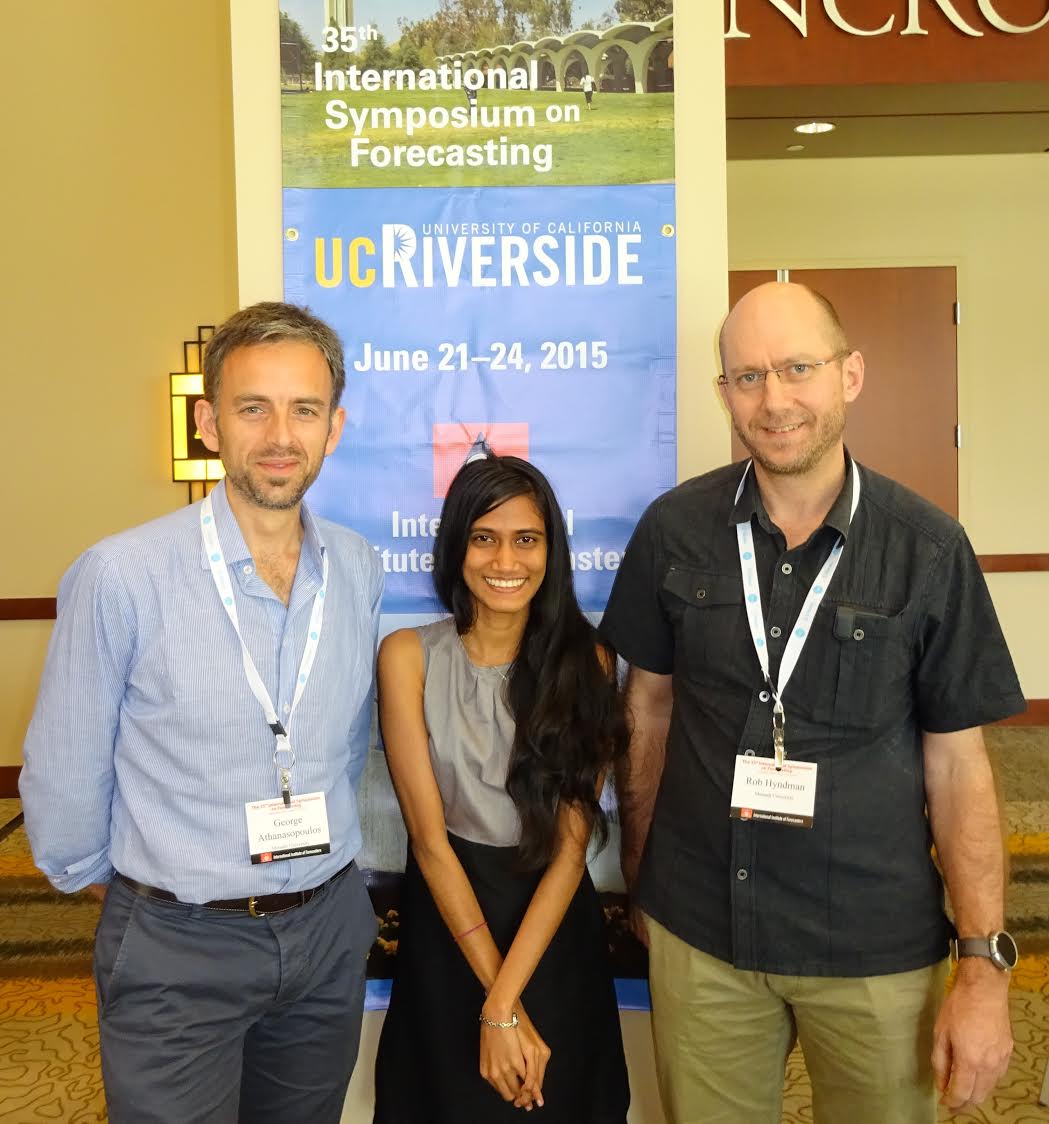
However, a new statistical tool developed at Monash Business School’s Department of Econometrics and Business Statistics, by Professor Rob J Hyndman, Associate Professor George Athanasopoulos and PhD student Shanika Wickramasuriya, is revolutionising the accuracy of forecasting.
And it is already being used by big name brands around the world such as Walmart, Nestle, SAP, Grand Vision Huawei and Bank of New York Mellon. Closer to home, detailed tourism forecasts have been generated by Tourism Australia. And Monash University has used this approach to forecast student enrolments.
Layering the forecasts
‘Hierarchical forecasts’ involve forecasting across various layers of big data sets within an overall forecast.
For example, a clothing manufacturer may want to forecast its fashion sales for the year. They then may want forecasts on male and female sales; sales across items of clothing; sales across colours; and then taking into account different sizes.
“Sales of male and female clothing should equal the sales of all clothing. However, when each item of clothing is forecasted separately, the separate forecasts tended not to add up to the total number of sales,” says Professor Hyndman.
In 2011 Professor Hyndman, Associate Professor Athanasopoulos and their team introduced an approach where each series in the hierarchy could be forecasted and then reconciled to ensure they added up to the overall forecast.
“Since then we’ve been trying to develop a mathematical algorithm that optimally reconciles the individual forecasts to the overall forecast,” Professor Hyndman says.
Shanika Wickramasuriya, in collaboration with another PhD student Earo Wang, spent three years developing the algorithm and writing the open-source R software package.
Accurate final forecast
This new method provides the best individual forecasts for every series in the hierarchy and then adjusts the forecasts so they add up to give the most accurate final forecast.
For example, a different forecasting method may be used to predict the number of shirts needed by the fashion manufacturer at a country level, up to city level. Then all the forecasts will be adjusted slightly so they all add up.
“We now have an algorithm that makes the adjustments to give the most accurate final forecast and even if there are millions of forecasts to adjust, the final forecast can be almost instantly obtained through our software package,” says Professor Hyndman.
In February, Dr Athanasopoulos delivered a keynote lecture at the Institute for Mathematics and its Applications (IMA) at the University of Minnesota, Minneapolis.
It was at this event that he received encouraging feedback from Bank of NY Mellon, which has been using the model for forecasting balance sheets.
“Clearly in a bank, balance sheets are fundamental – that it is really where you want forecasts to exactly aggregate – and this method works really well for them,” Dr Athanasopoulos says.
Sharing through open source
Professor Hyndman explains that the group’s ethos is to ensure their work is freely available.
“By making this tool available through open source software, these methods of forecasting can be implemented rapidly and picked up by anyone around the world,” he says.
This includes businesses in developing countries.
Since 2017, the software package has been downloaded on average, 2300 times per month. Now the tool is being used by businesses around the world across industries as diverse as finance, manufacturing, retail, energy, telecommunications and health.
Even the Australian Bureau of Statistics uses an equivalent approach to reconcile their seasonally adjusted data for unemployment statistics. Yet Professor Hyndman says there is still more work to be done.
“We’re pretty good at forecasting monthly and quarterly data,” he says. “Yet half-hourly data is important for energy demand. We haven’t yet developed particularly good models for this because the data has only been available for the last few years.
“What also makes it difficult is the inherent randomness in small-scale data, so to build a model for this scale data is very challenging.”